Technical analysis divides the world of trading.
Some see it as the answer to staying ahead of the market and maximising profits.
Others view learning and applying its principles as a waste of time. Time which could be better spent understanding business fundamentals to uncover stocks that have the right ingredients for growth.
So which is it?
It’s both and neither, and it really depends on you as an individual, your objectives and how much you believe in the power of patterns.
Why patterns matter
A ‘murmuration’ is the pattern made by a flock of birds as they move in a seemingly random, but perfectly co-ordinated pattern in the air.

Murmurations occur because each bird has the same objective – keep the flock tight together to make it difficult for predators to infiltrate while avoiding hitting each other.
As a result, the patterns of bird flocks can be mathematically modelled and therefore predicted.
How does this relate to trading?
Humans with the same objective (making money by trading) are likely to behave in similar ways to each other.
Normally guided by greed or fear, the same news or a shared perception of share price value, a group of investors will move in patterns which can be modelled and therefore predicted.
The theory goes, therefore, that if you can identify predictable behaviours, you can then take advantage of this to make your investment decisions to come out ahead.
Technical analysis is simply the use of mathematical formulas to make sense of seemingly random financial trends, which are then highlighted on the share price charts.

Technical trading is spotting and then acting on patterns
At it’s core, technical trading is all about identifying patterns of behavior that you have seen before and then taking advantage of your knowledge of what is likely to happen next to make your buy or sell decision.
Moving averages iron out short-term fluctuations to remove ‘noise’ from a chart to make it easier, and then there are indicators that focus on momentum, volatility and even simple trends – where a stock seems to follow a channel or ‘bounce’ off a certain price.
Learning the function of each indicator doesn’t need to be hard and the Marketech platform has been built to make them as simple as possible for you to identify and use. By playing around on the live charts, and reading up on their functions online you may well find yourself entering (and exiting) trades more effectively.
Here are four simple things to remember about technical analysis before you write it off or dive headlong into the science behind it.
1. Technical trading doesn’t need to be complicated to be effective
While at first technical trading may seem hugely complex and confusing, it doesn’t need to be.
Advanced technical traders may engage in fierce debates about the relative benefits of a MACD histogram as a buy/sell signal compared to an osciallating moving average, but for those getting started with technical trading, this level of detail is not always needed.
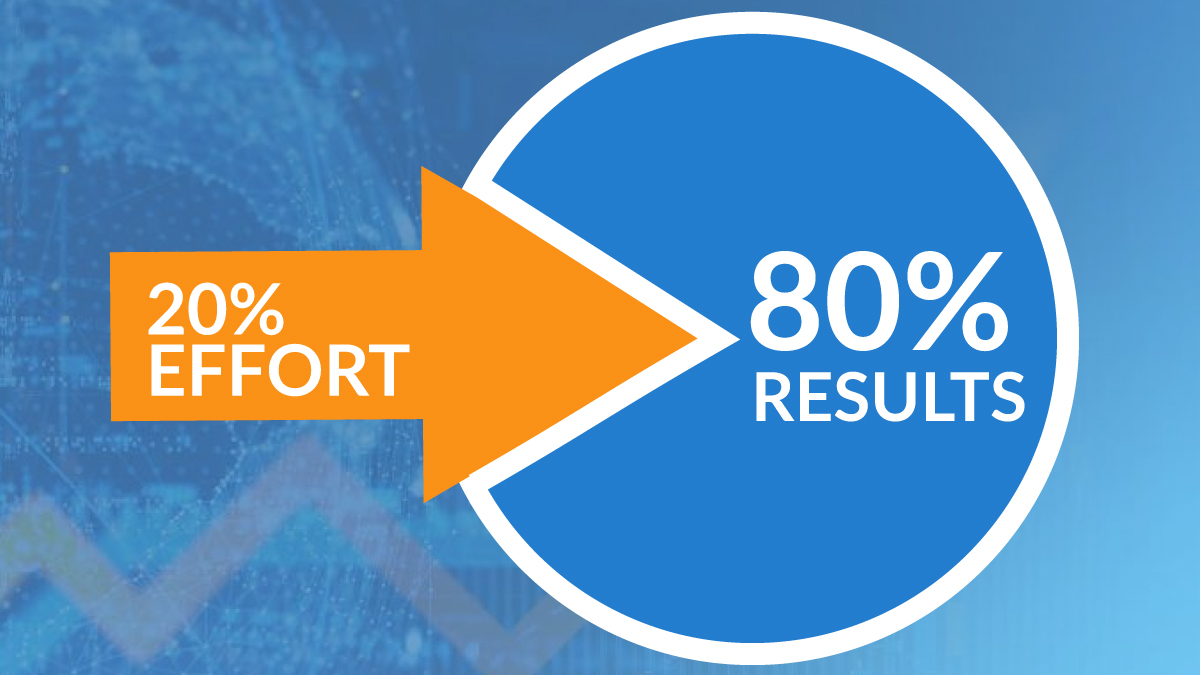
The Pareto principle, or the ‘80/20’ rule says that 80% of the effects come from 20% of the causes. If we apply this is technical trading, then applying the most important 20% of the theory should deliver 80% of the benefit. Beyond that and you’re into diminishing returns where your time and energy could be better spent on assessing other factors to inform your trading decisions.

A good way to look at it is that the fundamentals of a company (what it does, how big it is, how much money it makes etc) should help you choose a stock, while the technical analysis that can help you pick the right entry and exit point.
You can form a view, understanding of both the fundamentals and technicals of a share (Marketech Focus provides you with both sets of tools – at the click of a button), then it’s up to you whether you use them.
2. Technical trading isn’t infallible.. But this doesn’t mean it isn’t effective
We’ll get this out of the way: technical trading doesn’t work all of the time.
But often it does.
And in trading or investing, being right more often than not is what it’s all about.
Every indicator works sometimes and every indicator sometimes fails. There isn’t one indicator that is always right (that would be too easy!), but each technical indicator has a reason for being – they can all be used to make more informed trading decisions.
Before considering a trade entry you should consider the longer-term trends and whether a certain indicator (or combination of indicators) has worked well in the past.
Don’t rely on one timeframe, check how it looks when the chart is adjusted over different time periods. The best indicators for you are the ones whose inner workings you understand and the ones you are comfortable trusting because they perform well consistently and reliably for you.
And remember, if you entered a trade on the technicals you should probably exit in the same way.
Marketech’s charts make it easy to slip between multiple time periods from one minute to one month with live pricing, all within the palm of your hand.
3. Technical indicators often work because people believe in them
The interesting thing about technical trading is that the more people that use it to make their trading decisions, the more likely the stock is to follow those patterns. It’s like the birds – the movements of the flocks are predictable because each of the birds are following the same rules.
You may notice that the more heavily traded stocks will have more traders and therefore more technical traders. You may also notice technical points of inflection reflected in the depth with larger numbers of buyers and sellers lined up.
A major factor in understanding how heavily traded a stock is, and therefore how likely it is to adhere to technical trading patterns, is market depth.
Not many platforms offer true, expandable live depth and its importance can be often overlooked. Not having access to this information could mean that your technical analysis is significantly less effective.
You can see true market depth for any stock under the Market detail tab next to the company code on the Marketech platform:

4. ‘Support’ and ‘resistance’ are two of the most important technical principles to understand
Support and resistance are arguably the most important components of technical trading. Support areas are prices where buyers tend to overpower sellers i.e. there are more buyers than sellers and the price therefore does not fall below a support level

Resistance is the opposite – they are prices where sellers tend to overpower buyers and the price does not exceed a resistance level:

These two principles may sound obvious when you see them in the graph, and this is one of the examples where the performance of a stock may be able to be predicated because other people are also watching out for the same indicators.
Other traders will also watch the market approaching a well-known support or resistance level and then take action, either exiting their current position into that level en mass, or entering a new position as the market bounces off that level.
By knowing what other traders are likely to do, you can then make your own decision on what action to take to take advantage of the likely trend.
The key to technical trading is to stay engaged and informed, learn from your mistakes and keep emotion out of your trading decisions.
Marketech Focus provides the data and tools to help you maintain your edge, the rest is up to you.
This content does not constitute financial advice, however any advice implied to be provided is general and does not take into account your objectives, financial situation or needs. You should consider whether any advice is suitable for you and your personal circumstances.