If long-term investing is about ‘time in the market’, successful trading is all about timing the market, especially if the markets are whipsawing in response to global events.
So how do you increase the likelihood that you’re on the right side of market movement?
In this blog, we’ll have a look at three high probability trading patterns that can be used to identify likely market movements, and show you how you can take advantage.
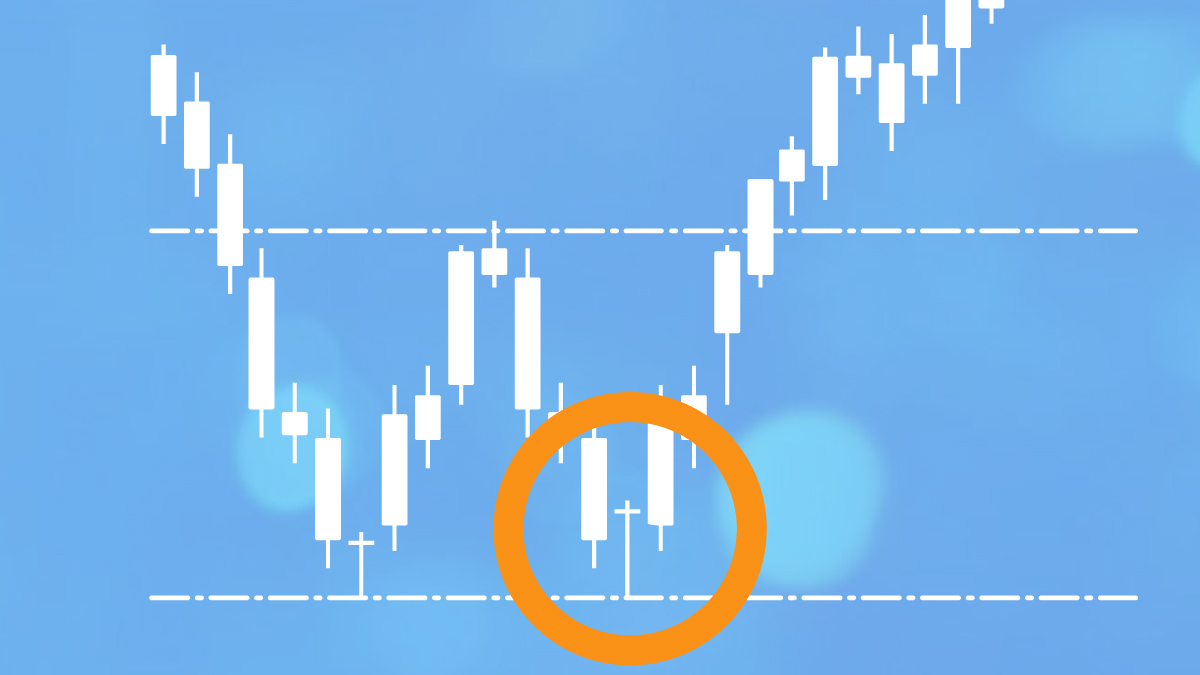
Reversal of downtrend: double bottom pattern
A double bottom is a change in trend and can indicate a momentum reversal from prior leading price action.
A stock’s price will drop, rebound upwards, drop again to a similar level as the original drop and then finally rebound upwards again:
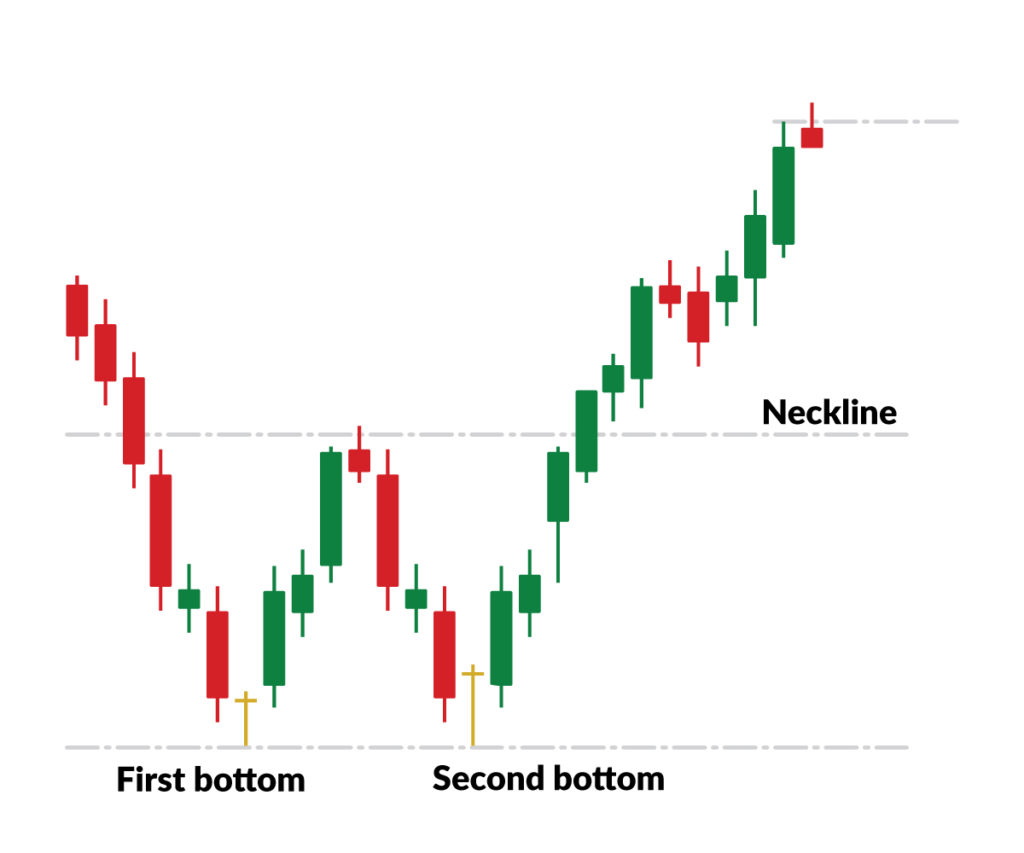
What the double bottom can mean:
The double bottom pattern follows a down trend, and is the beginning of a reversal a potential uptrend. reversal in market conditions.
Increasing trading volumes during the two upward price movements are a strong indication of upward price pressure, increasing the probability of a successful double bottom.
How to identify the double bottom:
A double bottom looks like the letter “W”, with the low value at the bottom of the W considered a support level.
What to watch out for:
While the double bottom can be a good indicator of a potential uptrend, it’s important to validate this by examining the fundamentals of the share and the current state of both its sector and the market in general. These should all support the likelihood that there will be an uptrend in the share’s price.
Bullish flag
A flag pattern is a price chart characterised by a sharp countertrend (the flag) which follows a short-lived trend (the flag pole):
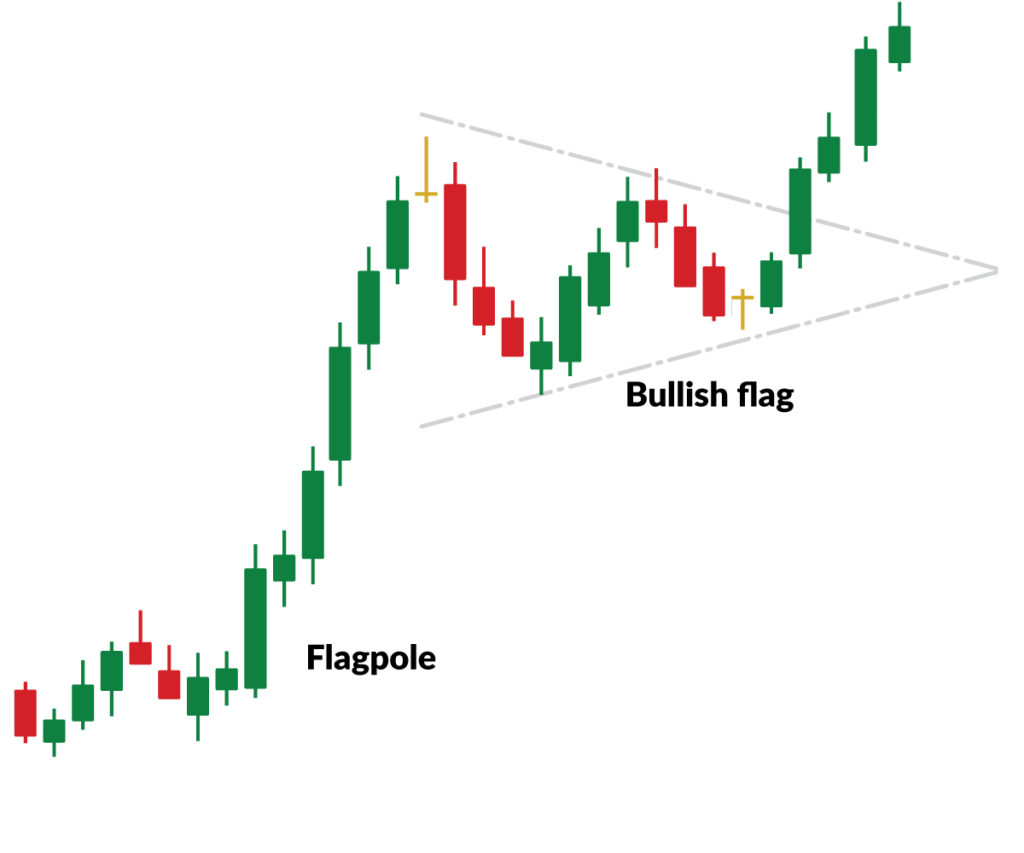
Flag patterns have five main characteristics:
- A preceding trend
- The consolidation channel
- The volume pattern
- A breakout
- A confirmation where price moves in the same direction as the breakout
What the bullish flag can mean
The flag pattern can be used to identify a possible continuation of a previous trend following a period where the price has drifted against the original trend.
If the trend resumes, the price increase could be rapid, meaning that investors who can identify the flag pattern and get in front of the market can take advantage.
How to spot it:
In a bullish flag pattern, the price action rises during the initial trend and then declines through the consolidation area.
A high volume surge in the breakout is generally viewed favourably as it implies that other traders have entered the stock in a new wave of enthusiasm and the price is likely to trend upwards again.
What to watch out for:
While flags can suggest a continuation of the current trend, it’s a good idea to wait for the initial breakout to avoid a false signal.
Reversal of uptrend: head and shoulders
A head and shoulders pattern shows three peaks, with outside two similar in height (the shoulders) and the middle standing higher (the head):
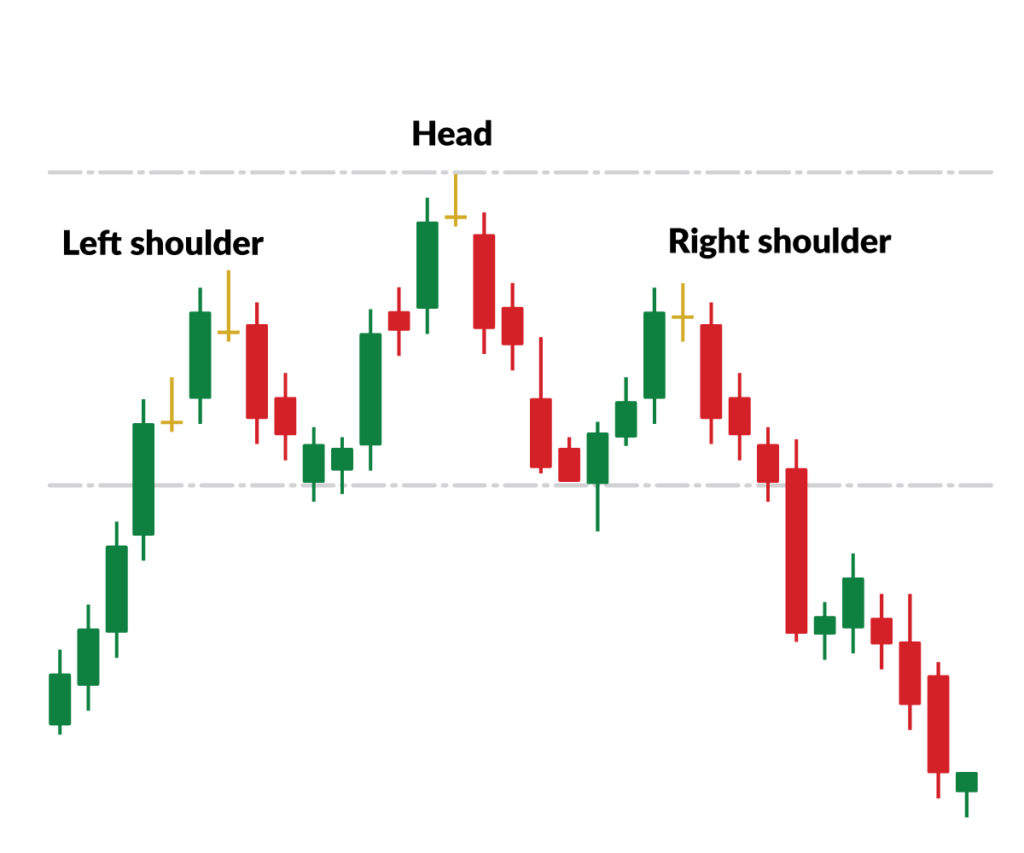
What the head and shoulders can mean
The head and shoulders pattern is believed to be one of the most reliable trend reversal patterns and can indicate a bullish-to-bearish trend reversal.
What to look for:
A head and shoulders pattern is comprised of three component parts:
- After long bullish trend, the price rises to a peak and subsequently declines to form a trough.
- The price rises again to form a second high substantially above the initial peak and declines again.
- The price rises a third time, but only to the level of the first peak, before declining once more.
What to watch out for:
While the head and shoulders pattern can be used to exploit big market movements, it can be difficult to identify for novice traders and price pullbacks cam retest the neckline which may confuse less experienced traders.
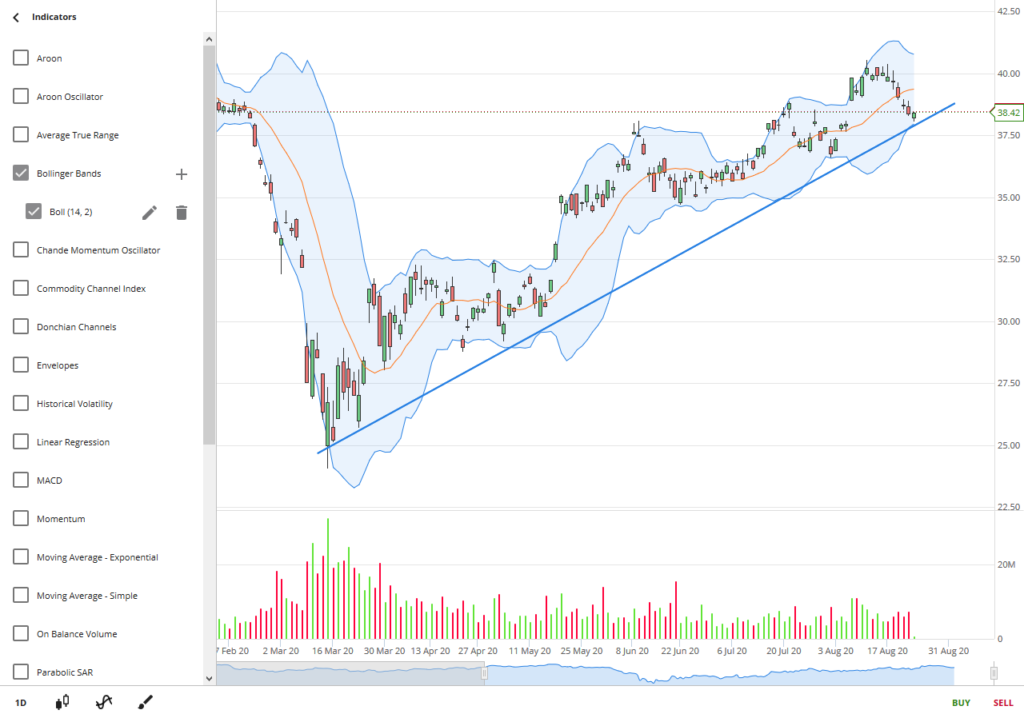
Using Marketech’s charts and technical analysis tools
The Marketech platform has been built to make it as easy as possible for ASX traders to identify and act on opportunities.
As well as 9 different chart types (including line, candles, OHLC, etc), 25 customisable technical indicators (including moving averages, RSI, Bollinger bands, etc) plus the usual drawing tools (eg: lines, text and a trade planner), Marketech Focus also allows you to trade on the chart itself.
Trading on the chart
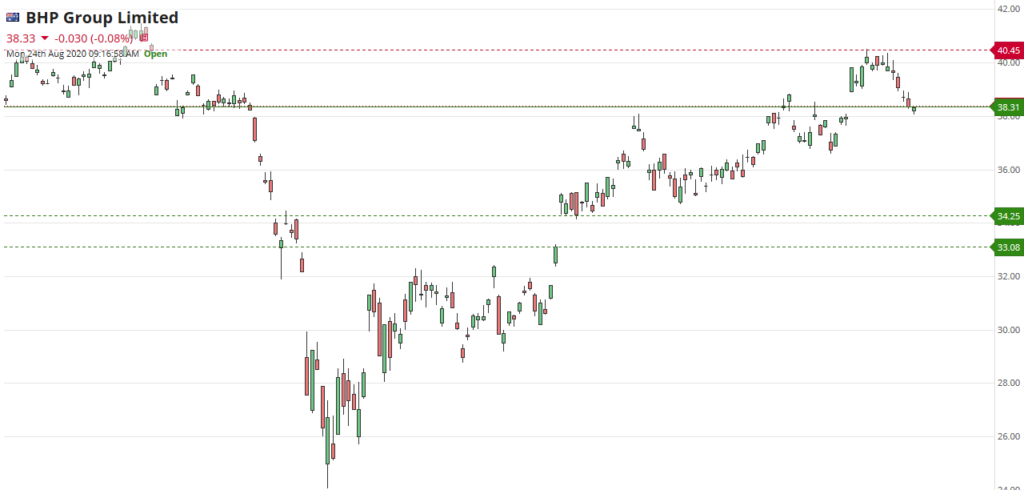
Once you’ve set your chart up the way you like it, you can place buy or sell orders by sliding the selector on the chart and then choosing the number of units you wish to sell.
To ensure you know your relative position, your cost base (what you paid for a share holding) is shown by a line on the chart as a ready-reckoner.
Your outstanding buy and sell orders are also shown, and these can be easily edited on the chart by sliding the selector to the new position, and confirming the change. This is especially useful when trading trends, for example if a stock looks like it bounces at a certain price, or if it past beaaviour indicates that it may sell off a certain amount before building up again.
Here’s what it looks like on the system:
- Unbroken green line = cost of the parcel you own
- Dotted green = buy orders below the market price
- Dotted red line = sell order above market
Set alerts based on live data
While our mobile app allows you to monitor charts on the move, it’s unlikely that you want to be manually watching a screen for every stock you’re interesting in.
To ensure you can take the action you need, our platform offers price alerts (e.g. BHP trades at/or below $1,650), volume alerts (e.g. BHP has transacted 100,000 shares) or a combination of both (e.g. BHP traded above $1,650 on more than 200,000 shares).
Stock specific news alerts can also be delivered to your computer or mobile device to keep you across the fundamental side of things.
Try our data, alerts and charting tools for free
If you’d like to see how Marketech’s data and charting packages can help your trading, we’d love to show you. Just sign up below for a free two week trial where you’ll have full access to everything.
Before making any real trades, you can try all of the features using a ‘paper trader’ account, which allows you to practice trade all of the functions before you enter the real market.
Plus, when you feel ready to start using the tools for real, Marketech members can take advantage of brokerage fees from just $5, or 2 basis points.
This content does not constitute financial advice, however any advice implied to be provided is general and does not take into account your objectives, financial situation or needs. You should consider whether any advice is suitable for you and your personal circumstances.